Logistic#
#logistic #로지스틱 #sigmoid
탄생 배경#
로지스트형 개체군 성장모델(logistic model of population growth)는 개체군 생태학에서 개체군의 증가율을 설명하는 모델로 1838년에 Verhulst가 고안한 모델이다. 이 모델에 따르면 일정하지 않은 환경, 한정된 자원 내에서의 개체군 밀도가 증가함에 따라 자원 요구가 증가하게 되고, 이는 개체당 출생률의 감소, 개체당 사망률의 증가를 가져오게 되므로 개체군의 성장은 감소할 것으로 보여준다.
\[
\tag{sigmoid}
f(x) = \frac{1}{1+e^{-x}}
\]
여기서 x는 input, e는 자연상수(약 2.71828)을 의미한다. input은 실수 전체를 정의역으로 가진다. output은 0~1 사이의 값을 가지면서, x=0일 때 0.5이다. x가 양의 무한대로 가면 출력값은 1에 가까워지고, 반대로 음의 무한대로 가면 출력값은 0에 가까워진다.
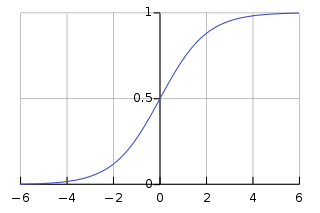
Fig. 4 로지스트형 곡선의 표준형 - 딱 그냥 시그모이드 함수가 생각나버리는 모양이다.#
시그모이드 함수는 미분이 가능하며, 미분 결과 역시 해당 함수를 이용해서 표현할 수 있다. 미분을 하면 아래 수식처럼 된다.
\[
\tag{deriative of sigmoid}
f`(x) = f(x)(1-f(x))
\]
katex#
\[
h(x) = \frac {1} {1+e^{-x}}
\]
chain rule을 통해서 기본식에서 derivative 식까지 이해해보기
\[\begin{split}
\begin{equation}
\begin{split}
h'(x) &= \frac {\partial} {\partial x} h(x) \\
&= \frac {\partial} {\partial x} \Big[ \frac {1} {1+e^{-x}} \Big]=\frac {\partial} {\partial x} (1+e^{-x})^{-1}\\
&= -1 *(1+e^{-x})^{-2}(-e^{-x})\\
&= \frac {-e^{-x}} {-(1+e^{-x})^2} = \frac {e^{-x}} {(1+e^{-x})^2}\\
&= \frac {1} {1+e^{-x}} \frac {e^{-x}} {1+e^{-x}}\\
&= \frac {1} {1+e^{-x}} \frac {1+e^{-x}-1} {1+e^{-x}}\\
&= \frac {1} {1+e^{-x}} \Big[ \frac {(1+e^{-x})} {1+e^{-x}} - \frac {1} {1+e^{-x}} \Big]\\
&= \frac {1} {1+e^{-x}} \Big[ 1 - \frac {1} {1+e^{-x}} \Big]\\
&=h(x)(1 - h(x)) \\
\end{split}
\end{equation}
\end{split}\]
numpy#
import numpy
import matplotlib.pyplot as plt

def sigmoid(x):
    return 1 / (1+numpy.exp(-x))

def sigmoid_derivative(x,step):
    return (sigmoid(x + step) - sigmoid(x)) / step

def other_derivative(x):
    y = [(1 / (1 + numpy.exp(-i))) * (1 - (1 /(1 + numpy.exp(-i)))) for i in x]
    return y

x = numpy.linspace(-10, 10, 1000)

y1 = sigmoid(x)
y2 = sigmoid_derivative(x, 0.0000000000001)
y3 = other_derivative(x)

plt.plot(x, y1, label='sigmoid')
plt.plot(x, y2, label='derivative')
plt.plot(x, y3, label='other derivative')
plt.legend(loc='upper left')
plt.show()